
Why MENA’s Biggest Shopping Season Is Won Before the Salary Lands?
Platformance’s new report finds that shoppers across the region spend to a monthly rhythm, and that Q4 simply turns the volume up. For marketers, the quiet fortnight is the opportunity.
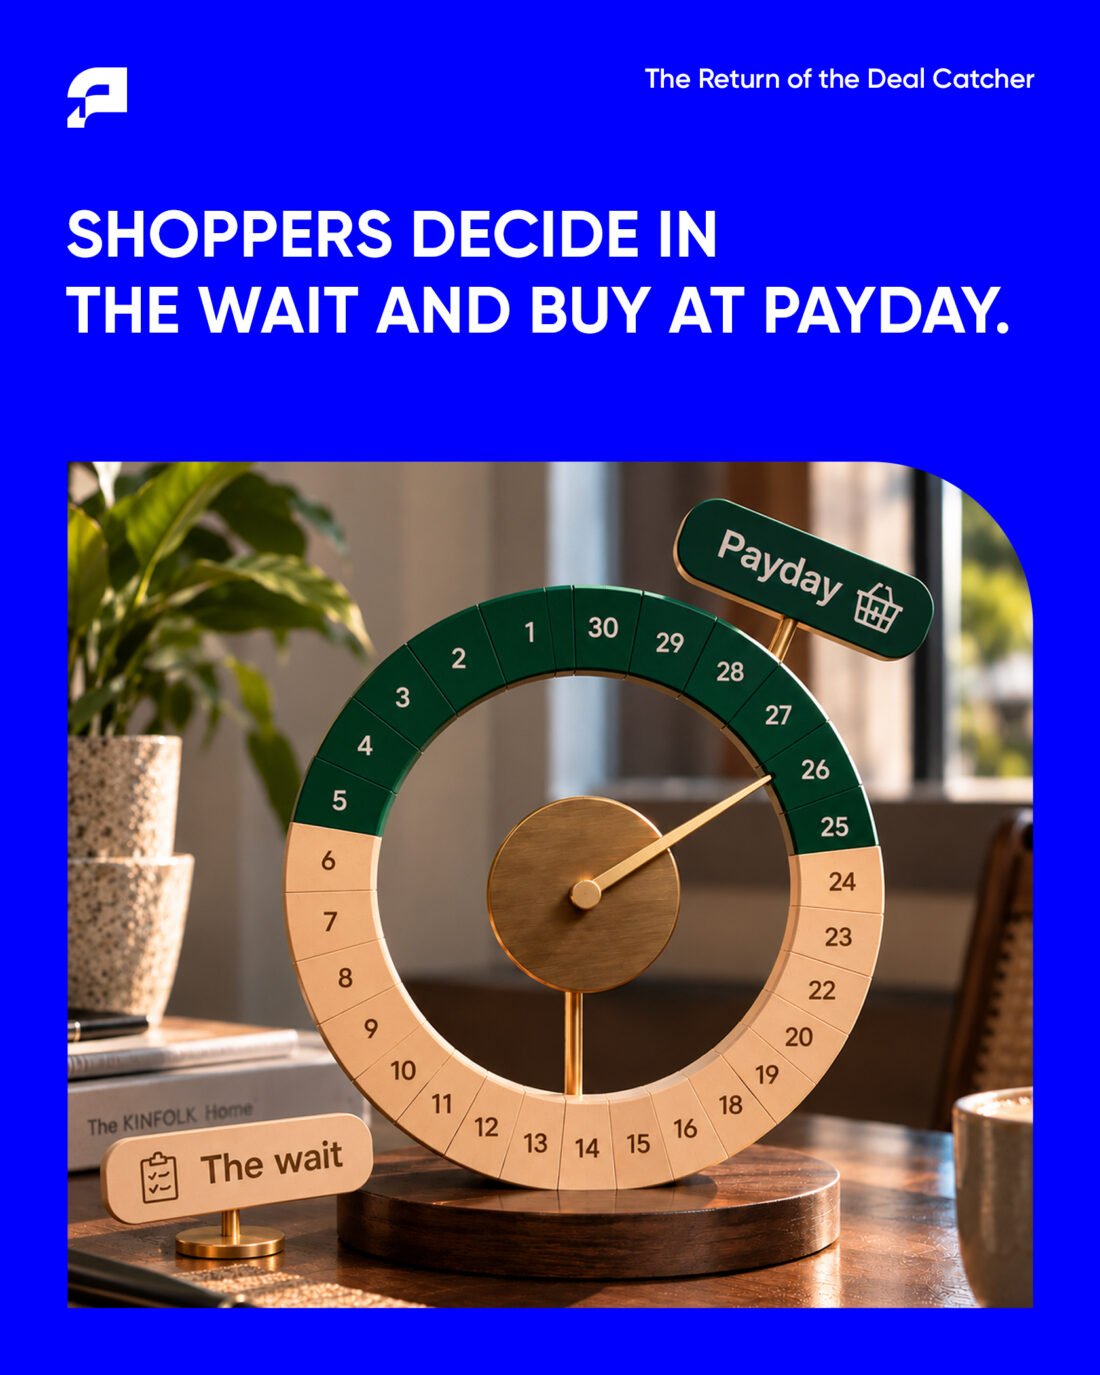
Khalid has wanted a new television for the family majlis since the summer. In September he reads the reviews and watches the YouTube comparisons. By November he has a shortlist of two, and he parks both in his basket. Then he waits. His salary lands on 26 November. The next day, White Friday, one of the two drops in price, and he buys it.
Khalid is an illustrative composite, drawn by Platformance for its new report, The Return of the Deal Catcher. But the behaviour behind him is measured, and it carries a useful lesson for anyone planning the final quarter of the year: the discount did not make Khalid buy a television. It decided which television he bought. The decision had been made weeks earlier, and the brands that were in front of him during those weeks were the ones on his shortlist.



A rhythm that runs all year
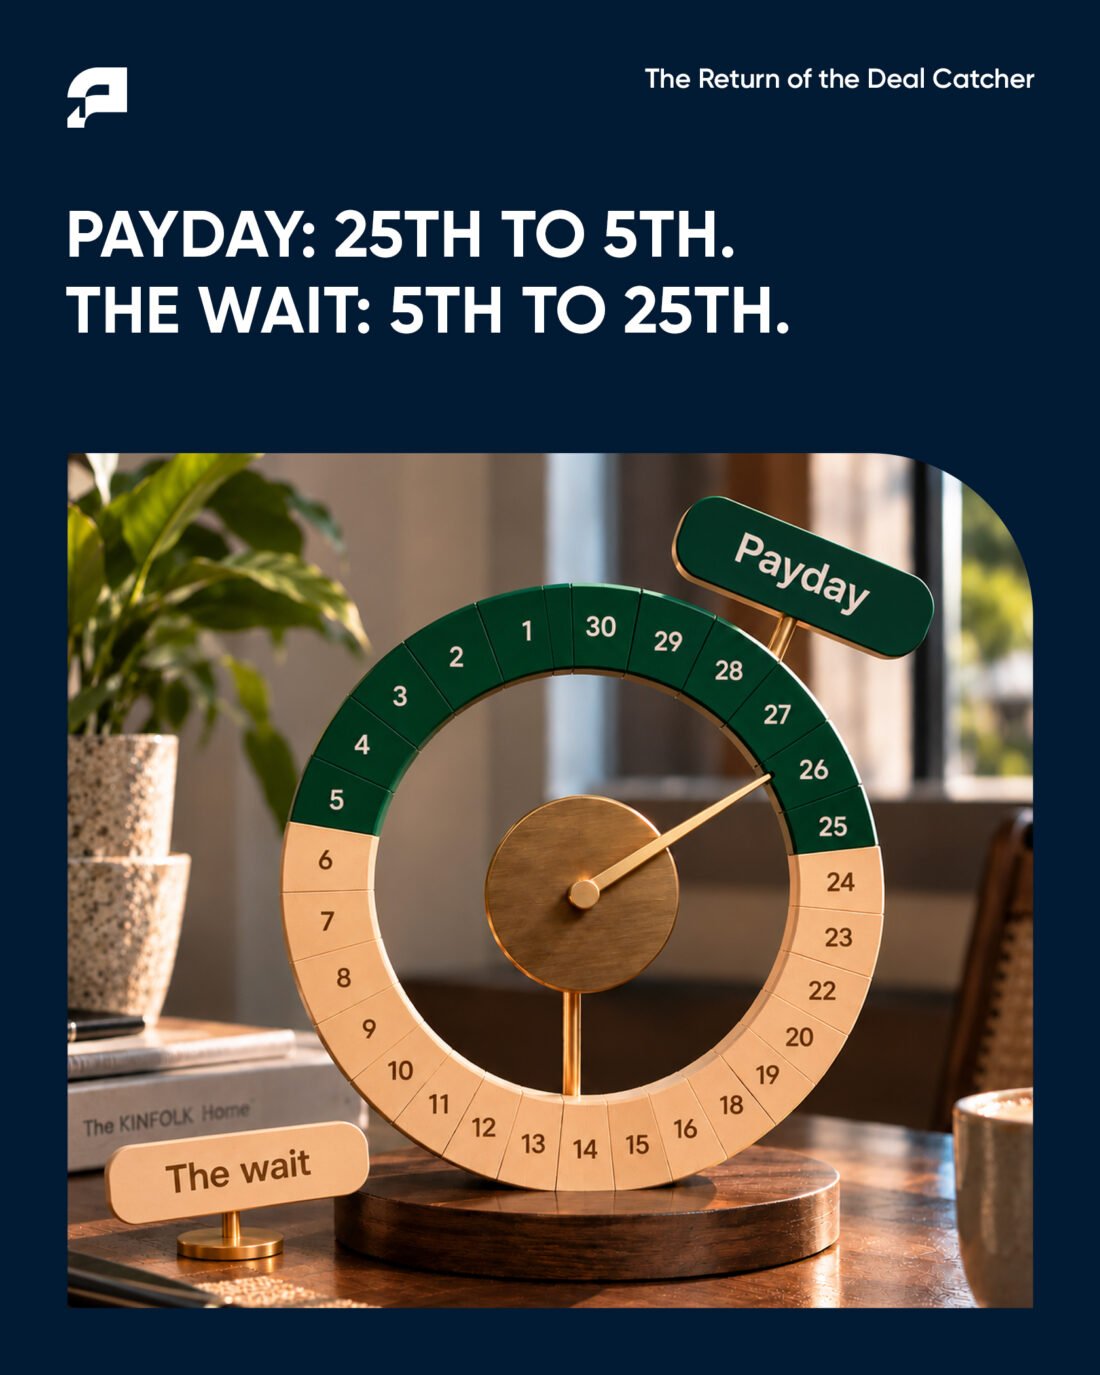
Platformance’s central finding is that the region’s shopper, whom it calls the deal catcher, spends to a predictable monthly schedule. Spending rises at the turn of the month, from the 25th to the 5th, when salaries arrive. The report calls this window payday. From the 5th to the 25th, spending falls back while shoppers keep watching, searching and comparing. The report calls this the wait.
The salary calendar explains why. Saudi government salaries are paid on the 27th of each month, or on the last working day before it when the 27th falls on a Friday or a public holiday. In the UAE, a ministerial resolution means private sector wages have been due on the first day of each month since 1 June 2026.
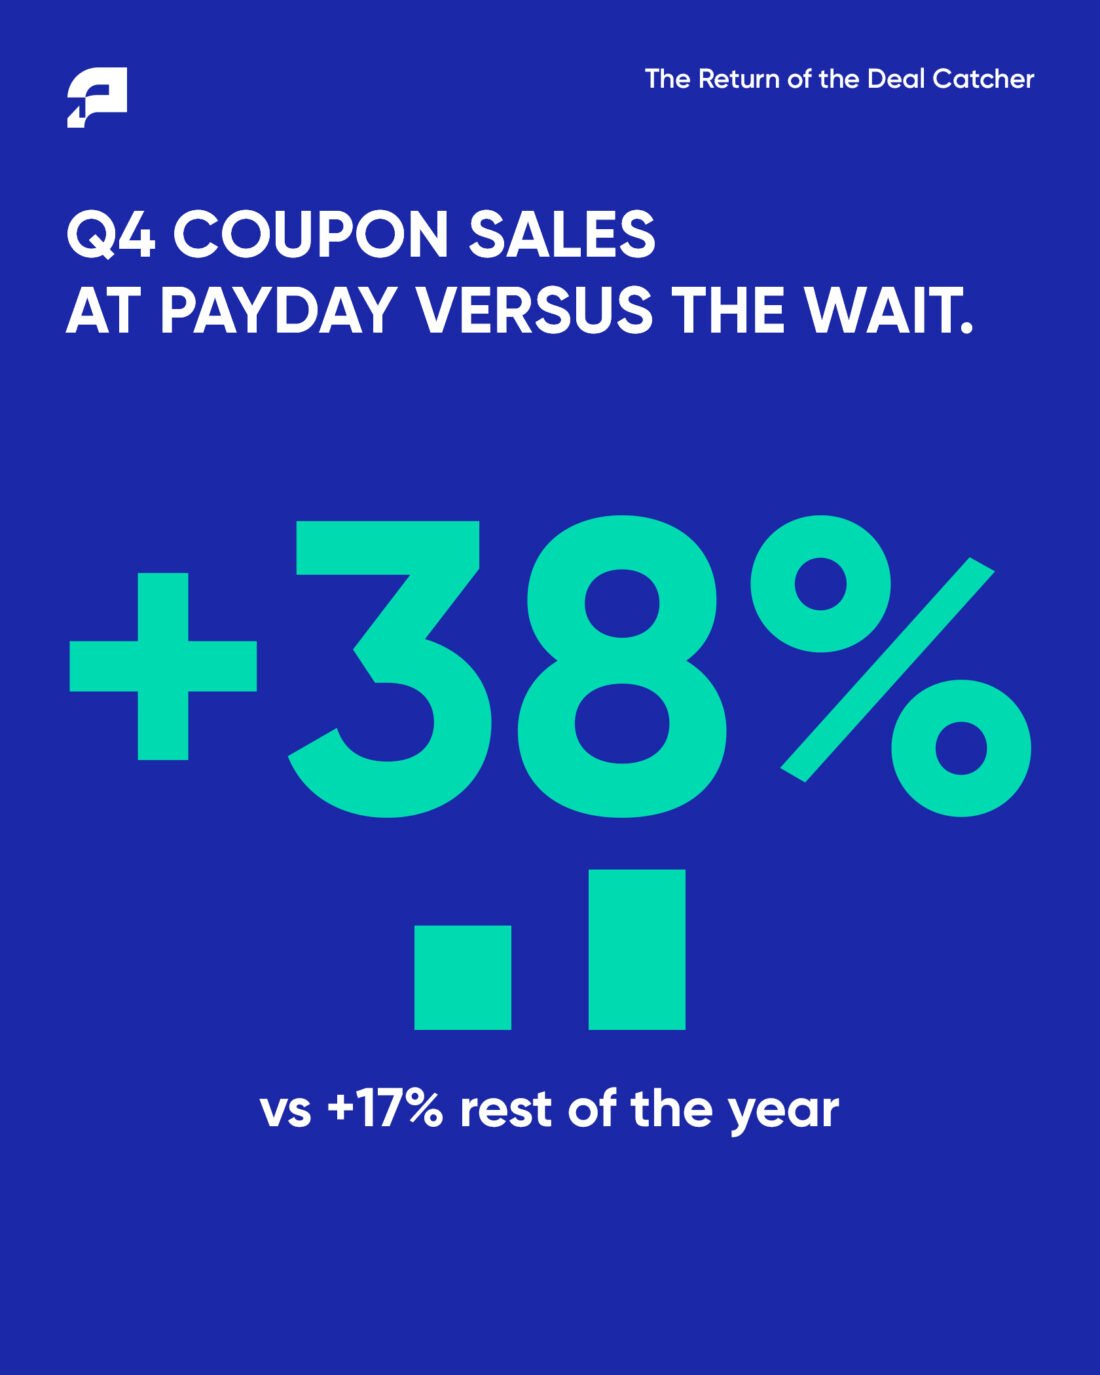
The pattern is not a Q4 story. Looking at coupon sales for the typical brand between January 2024 and May 2026, payday outsold the wait in every quarter: by 10% in Q1, 24% in Q2 and 18% in Q3. In Q4 the gap widened to 38%. Across the year outside Q4, the lift averages 17%. Of the 41 brands with enough data to compare, 29 showed a stronger payday lift in Q4 than in the rest of the year, and the ten best days of each Q4 all fell in the payday window.
The finding holds up against an independent source. Weekly card spending data from the Saudi Central Bank peaked at every month end in 2024 and 2025, and the gap between payday and the wait grew from one Q4 to the next. Sale events, in other words, add to the rhythm. They do not replace it.
Bigger baskets wait longest
The rhythm is strongest where the purchase is largest. Brands with a typical order above $40 rise most at payday, and Q4 sharpens the effect in the categories where shoppers plan. In home and furniture, the payday lift climbs from 30% across the rest of the year to 87% in Q4. Mother and baby goes from 39% to 71%, sport from 35% to 62% and electronics from 23% to 50%. These category figures rest on a small number of brands each, so they are best read as direction rather than precision. The direction is clear, though: the purchase that has been on the list for weeks waits for the salary and the deal to arrive together.
It also shifts the old assumption about sale days. In White Friday week, the report finds, the typical basket stayed close to October’s size. Sale days bring more orders, not bigger baskets. And the December payday, as it meets the festive season and New Year, outsold White Friday week as a whole in both seasons: by 25% against 7% in 2024, and by 31% against 12% in 2025.
11.11 is a category decision
Market totals for 11.11 are dominated by the biggest sellers, and they hide what the typical brand experiences. In Platformance’s affiliate data, 11.11 fell in the wait, and the typical brand sold below the weeks around it in both years. Saudi card spending tells the same story.
Fashion is the exception, and it is a striking one. On a leading online marketplace in November 2025, fashion sales per day rose 95% on 11 and 12 November against the first ten days of the month. They then fell 33% to 43% through the wait, and came back 65% higher for White Friday. Fashion shoppers buy on the event, pause, and return for the next one. For one fashion advertiser, sales dropped by more than a third after 11.11 while ad spend held steady.
The practical reading is simple. For fashion, 11.11 is a conversion day. For most other categories, conversion belongs to 26 to 30 November.
The wait is not empty
If sales fall in the wait, the temptation is to switch off. The data argues against it. On Google, searches for deals in English and Arabic were flat from September to October, then rose 15% from October to November, with four in five deal searches climbing. The pattern held in 2024 and 2025, across the UAE, Saudi Arabia and Egypt. Google and Visa data from September 2025 add a sharp detail: in the November peak week, deal related searches rose 69% while card spending rose 31% in the UAE and 36% in Saudi Arabia. Shoppers search in the wait and spend when the peak arrives.
Attention shows the same stability. Across 28,000 posts on creators’ own accounts, views in the wait ran as high as views at payday, in Q4 and at every other time of year. A creator’s fee is the same whichever day a post goes live. The wait, then, is when creator content does its most valuable work: the audience is watching but not yet buying.
Why creators look undervalued
This is where the report makes its most interesting argument. Coupon tracking credits the code entered at checkout, and deal sites are built to be the last step. A shopper who discovered a brand through a creator and then used a deal site’s code appears in the report as a deal site sale. In Platformance’s data, each deal site was credited with 15 times the coupon orders of each creator, and creators accounted for 3% of coupon orders overall. Creators start the purchase, deal sites complete it, and the report credits the last step.
The report separates two kinds of creator. Demand creators work in the wait, are paid up front for content and reach, and should be judged on reach, response and the searches and sales that follow. Conversion creators, often deal finders whose followers come for the offer, work at payday and in sale windows, are paid per order, and should be judged like any other conversion partner. Their codes keep the same clock as deal sites: both rise about 40% at payday in Q4.
The creator data also offers practical guidance on content and scale:
- Match format to category. Content for flexible spend, such as food and restaurant posts, reached 28% of followers, against 3% for planned spend categories like banking, telecoms, airlines and cars. But planned spend content drew 48 responses per 1,000 views against 23. Videos over a minute drew 38 responses per 1,000 views, against 16 for those of 30 seconds or less.
- Book more creators, not better guesses. 80% of campaigns with 11 or more creators produced a post with more than 100,000 organic views, against 27% of campaigns with one or two. The top 10% of posts drove 67% of organic views. The breakout post is hard to predict, so the number of creators matters more than the choice of any single one.
Four layers, one month
Platformance turns these findings into a framework of four layers, each with its place in the month:
- Attention keeps the brand in front of the 85% to 95% of buyers who are not yet in market, so it is remembered when they are. It runs early and always on, through rich media, YouTube and connected TV.
- Persuasion gives shoppers a reason to choose the brand and does its best work in the wait. This is the job of demand creators.
- Shortlist keeps the brand in view while shoppers search, compare and wait for the right deal: retail media, affiliate publishers and AI search, live through the wait at lower bids.
- Conversion turns the decision into a sale at payday, and works hardest where a sale event meets it: affiliate, conversion creators, retail media and pay per outcome partners.
The economics support the sequencing. Each retail media sale cost about a third more in November than in October, so starting early is cheaper. And a short list of coupon publishers drove 80% of coupon orders in Q4 last year, which is a good reason to book them before everyone else does.
Q4 2026: what to do now
The report sets out the remaining quarter as a calendar, with the biggest budget reserved for 26 to 30 November, when payday, White Friday and Cyber Monday arrive together.
The report’s five recommendations are direct: start before the October payday while clicks cost less; brief creators by 5 November for White Friday and by 5 December for the year end; treat 11.11 as a category decision; stay in view through November’s wait; and have partners live that can scale at each payday. That first creator deadline passed yesterday. Brands that missed it should brief this week, because the creators who go live before the 26th will still reach shoppers while they are deciding.
Beyond Q4
The report closes with four lessons for 2027. Plan budgets by the month around payday and the wait, then add events on top, since a sale event that meets a payday is worth more than one that does not. Start the next big season early: Ramadan 2027 is expected to begin around 8 February, subject to moon sighting. Keep a standing creator bench briefed monthly and live through each wait. And measure beyond the checkout, reading creator and attention results alongside deal site sales, and favouring partners that tie spend to the outcome you need, whether a sale, a lead or an install.
Reading the numbers
Good practice with any vendor study applies here, and the report is open about its limits. All of Platformance’s own figures are indexed and no brand is named. “The typical brand” is the middle brand in the data, a choice that stops a few large advertisers from moving the totals. The affiliate figures cover coupon and tracked link sales only, so sitewide discounts without a code are not captured, and brands that restrict codes on White Friday would understate that peak. Several category findings rest on a handful of brands, and the fashion 11.11 data comes from a single leading marketplace. Search volumes come from modelled Ahrefs data, so the report reads timing and relative change rather than absolute volumes. The creator findings also come from Platformance’s own campaign work.
Marketers should also note that the recommended channels, including affiliate, creators and retail media, are ones Platformance operates. That does not weaken the data, much of which is corroborated by Saudi central bank card spending and by Google and Visa figures, but it is a reason to test the playbook against your own category before committing the whole budget.
The central insight is robust enough to act on regardless. Shoppers across MENA are not idle between paydays. They are deciding. The brands that stay in view through the wait are the ones on the list when the salary lands.